Decoder · Body
How to read your DEXA scan
Body fat percent, lean mass, visceral fat, and bone density, region by region. A decoder for the report you get the night after your scan.
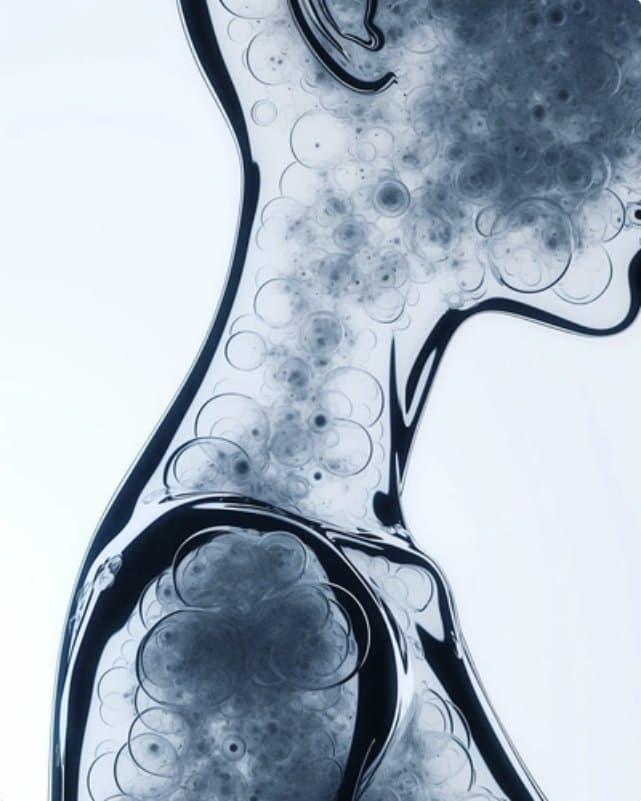
A DEXA scan passes two X-ray energies through you and reads how each tissue attenuates them. Out of that comes a three-compartment picture, fat mass, lean soft tissue, and bone, mapped region by region rather than averaged into one number.
The report can run several pages. These are the lines worth reading first.
Appendicular lean mass is the lean tissue in your arms and legs, which is mostly skeletal muscle. Divided by height squared it becomes ALMI, the index used to define low muscle mass: the European consensus draws the line at 7.0 kg/m² for men and 5.5 for women. You want distance from those floors in midlife, because muscle is easier to keep than to rebuild. Lean mass is also the scan's most precise measure, with repeat error near 1%, so a trend of even a few percent is believable.
Body fat percent is the headline, but the regional split carries most of the information. The android region approximates the waist and the gynoid region the hips, and their ratio tracks cardiometabolic risk better than weight does. The visceral fat estimate is calibrated against CT, the reference method, with correlations above 0.9; its absolute value is an estimate, so treat it as a number to trend against your own baseline rather than judge once.
Bone density is reported as standard deviations from a reference. The T-score compares you with a healthy thirty-year-old; the Z-score compares you with people your own age and sex. The familiar cutoffs, osteopenia below a T of minus 1.0 and osteoporosis at minus 2.5, formally apply to postmenopausal women and men over 50. Before menopause, densitometry guidance says to read the Z-score instead, and a Z at or below minus 2.0 is a prompt for investigation, not a diagnosis.
Every measure has a repeatability floor, and densitometry has a standard rule for it: a change must exceed about 2.8 times the machine's repeat error before it counts as real. In practice, a 0.3-point shift in body fat percent between quarters is the machine; a two-point shift is you. This is also why scans on the same machine, prepared the same way, compare cleanly, and scans across facilities often do not.
- 01Cruz-Jentoft AJ, et al. Sarcopenia: revised European consensus on definition and diagnosis (EWGSOP2). Age and Ageing, 2019.
- 02Studenski SA, et al. The FNIH Sarcopenia Project: rationale, study description, and final estimates. Journals of Gerontology Series A, 2014.
- 03Kaul S, et al. Dual-energy X-ray absorptiometry for quantification of visceral fat. Obesity, 2012.
- 04International Society for Clinical Densitometry. 2019 ISCD Official Positions, Adult.
- 05DXA reliability and intraobserver reproducibility for segmental body composition. Nutrición Hospitalaria, 2018.